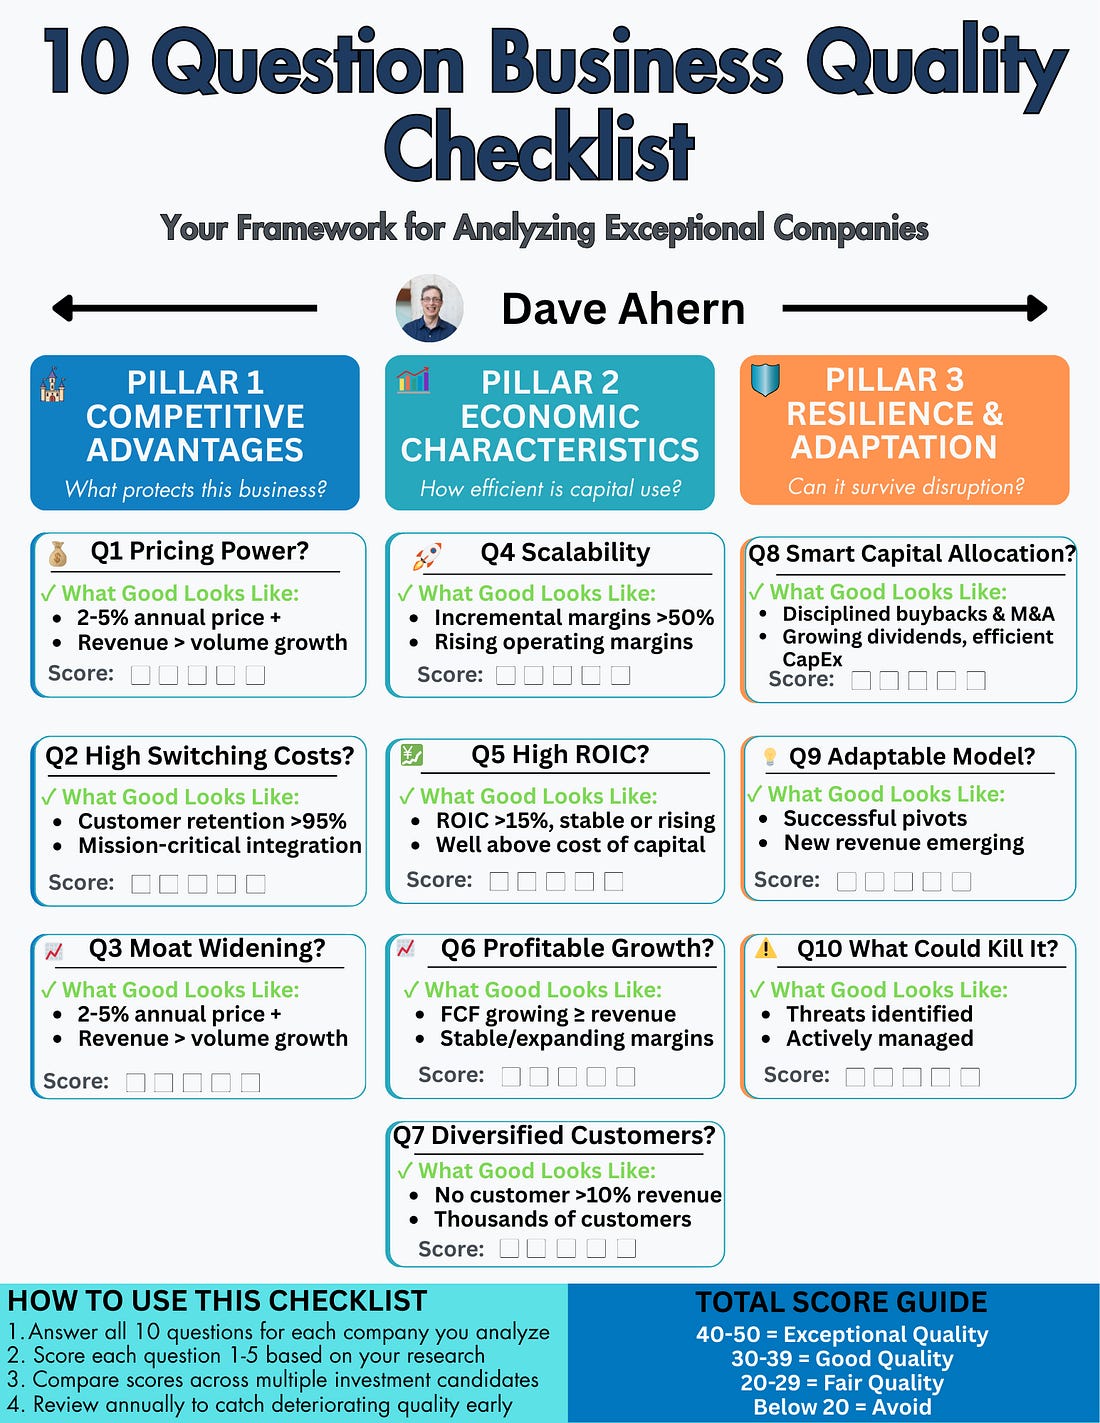
Happy New Year, investors! January was packed with foundational metrics every value investor should have in their analytical toolkit. Whether you’re analyzing your first stock or refining your process after years of investing, these 10 infographics cover the essential frameworks and ratios I use to evaluate businesses. This month, we focused on business quality assessment, profitability analysis, operational efficiency, and insurance business metrics, topped off with a deep dive into one of Buffett’s greatest investments. Each infographic is designed to give you a practical tool you can immediately apply to your investment analysis. Let’s break down how to use each one. 1. 10 Question Business Quality ChecklistEvery investment decision starts with a fundamental question: Is this a quality business? This checklist gives you a systematic framework to evaluate any company across ten critical dimensions—from competitive moat strength to management quality to financial sustainability.
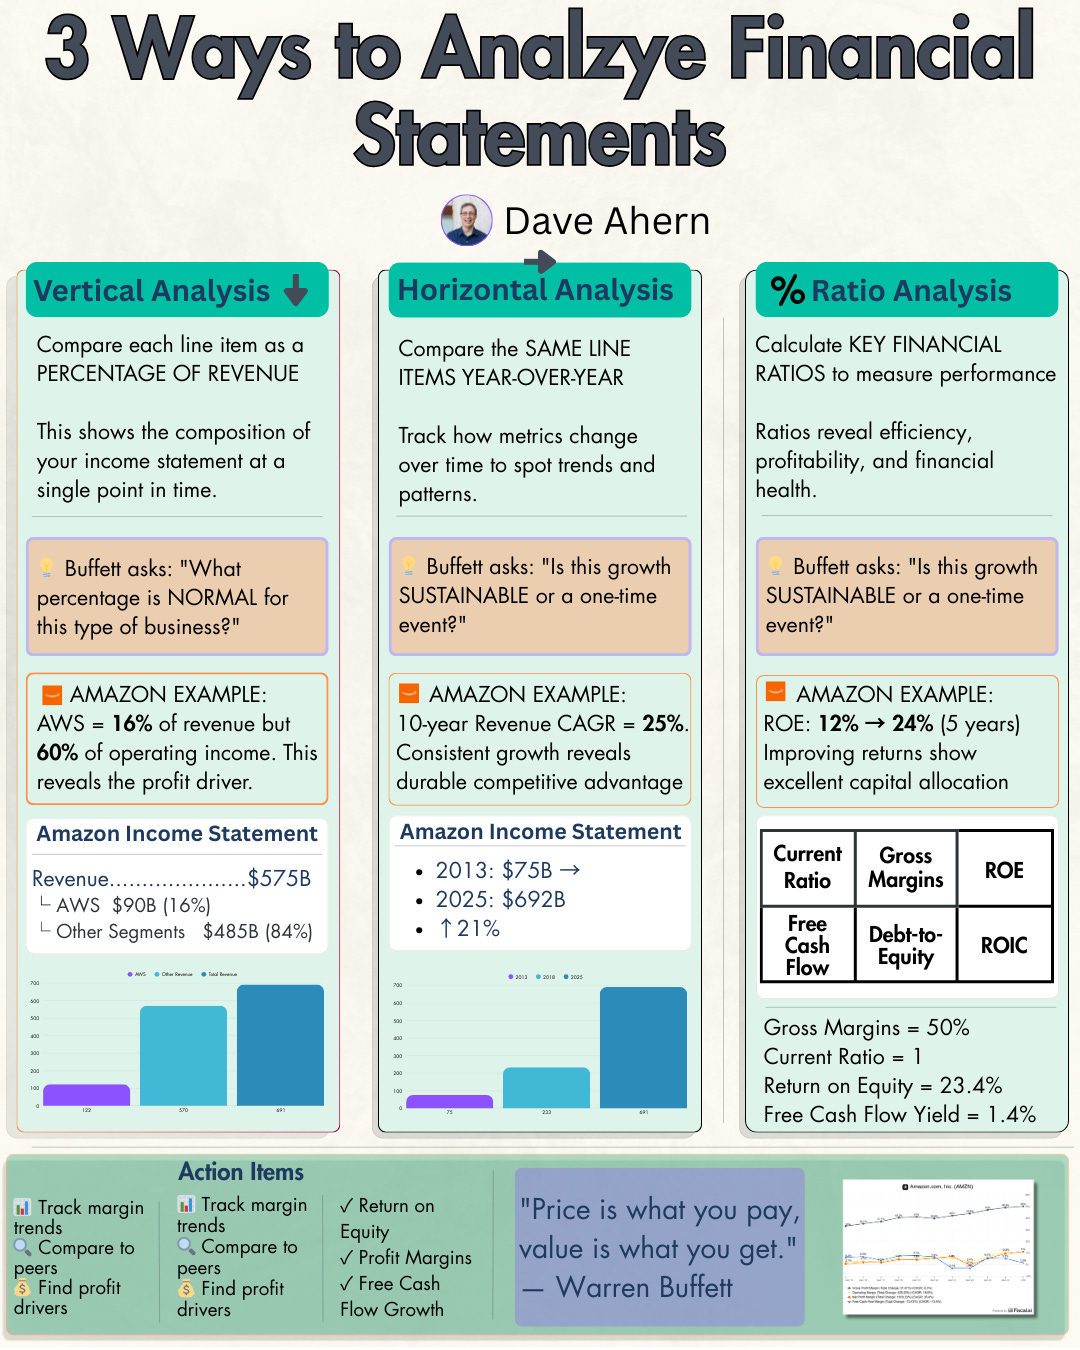
How to use it: Run every potential investment through these ten questions before diving into valuation. Think of it as your initial quality filter. A business should score well on at least 7-8 of these questions to warrant deeper analysis. The checklist covers moat durability (can competitors replicate their advantage?), pricing power (can they raise prices without losing customers?), capital efficiency (do they generate strong returns without massive reinvestment?), and management alignment (are insiders buying stock?). Practical application: If a company fails on multiple questions, especially around moat strength or capital efficiency, it’s often better to pass entirely rather than hope for a cheap valuation to compensate. Quality compounds over time; mediocrity doesn’t. 2. 3 Ways to Analyze Financial StatementsFinancial statements can feel overwhelming with hundreds of line items. This infographic breaks down the three core analytical approaches: horizontal analysis (comparing trends over time), vertical analysis (understanding component relationships), and ratio analysis (measuring efficiency and profitability).
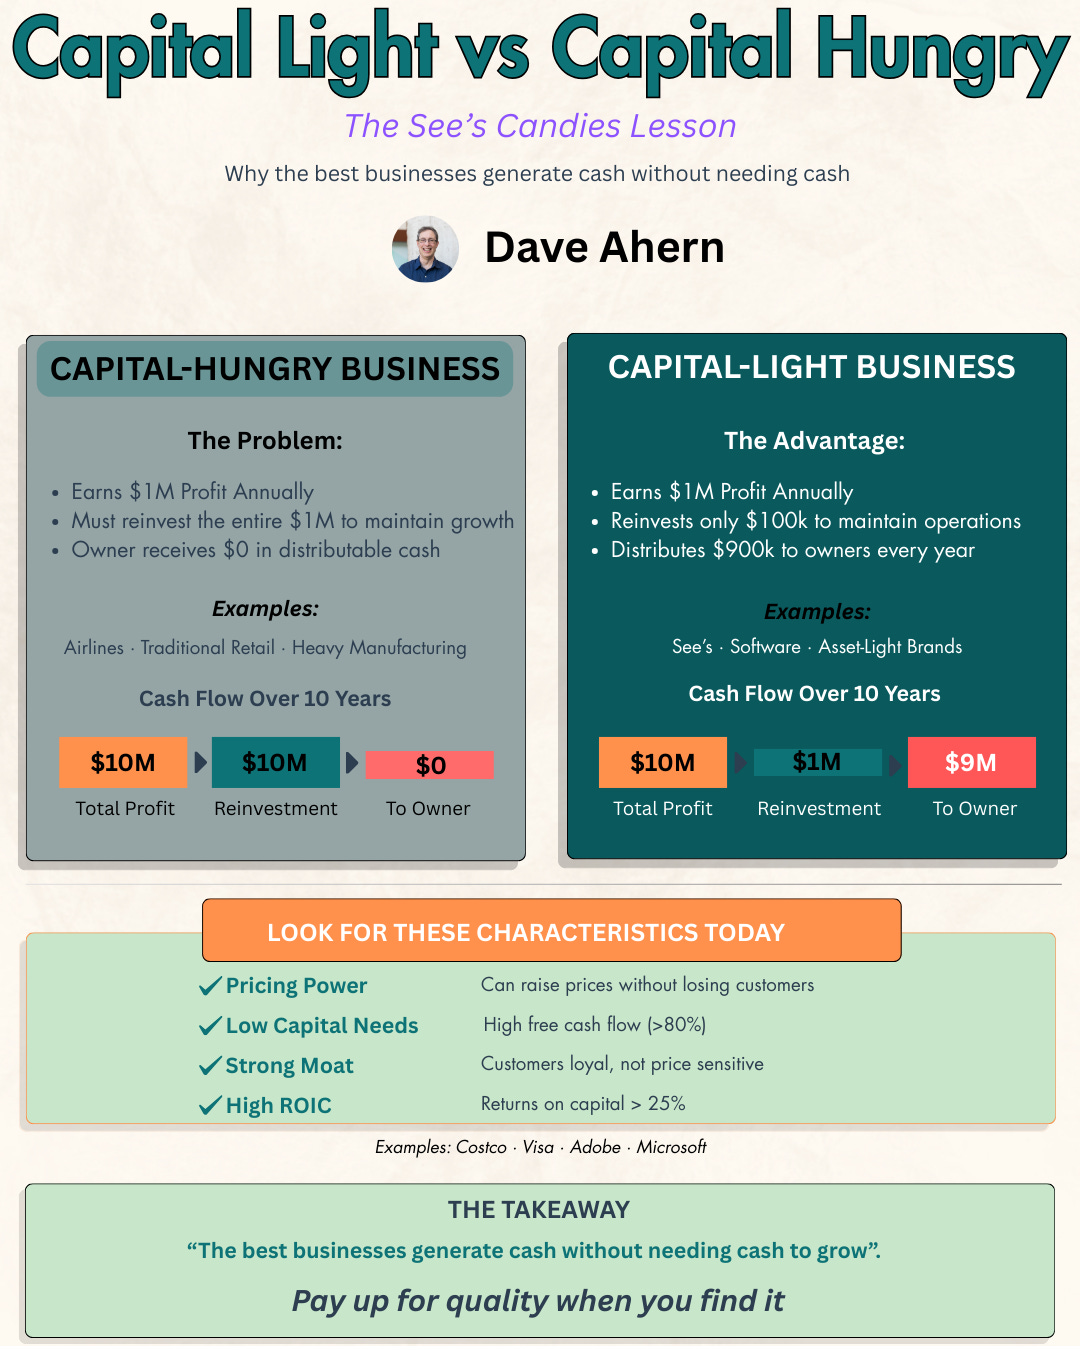
How to use it: Start with horizontal analysis to spot trends—is revenue growing consistently? Are margins expanding or contracting? Then use vertical analysis to understand the business model—what percentage of revenue becomes operating profit? Finally, apply ratio analysis to measure efficiency and compare against peers. Good range: For horizontal analysis, look for consistent revenue growth (10%+ annually for growth companies, 5-7% for mature businesses). In vertical analysis, operating margins above 15% typically indicate competitive advantages. For ratio analysis, ROE above 15% and asset turnover ratios higher than industry averages signal strong management. Practical application: Use all three approaches together. A company might show revenue growth (horizontal) but declining margins (vertical), with return on equity deteriorating (ratio). That’s a red flag, even if the top line looks good. 3. Capital Light vs Capital HeavyOne of Buffett’s key insights: the best businesses generate high returns without requiring constant capital reinvestment. This infographic contrasts capital-light business models (software, asset-light services) with capital-heavy ones (manufacturing, utilities, airlines).
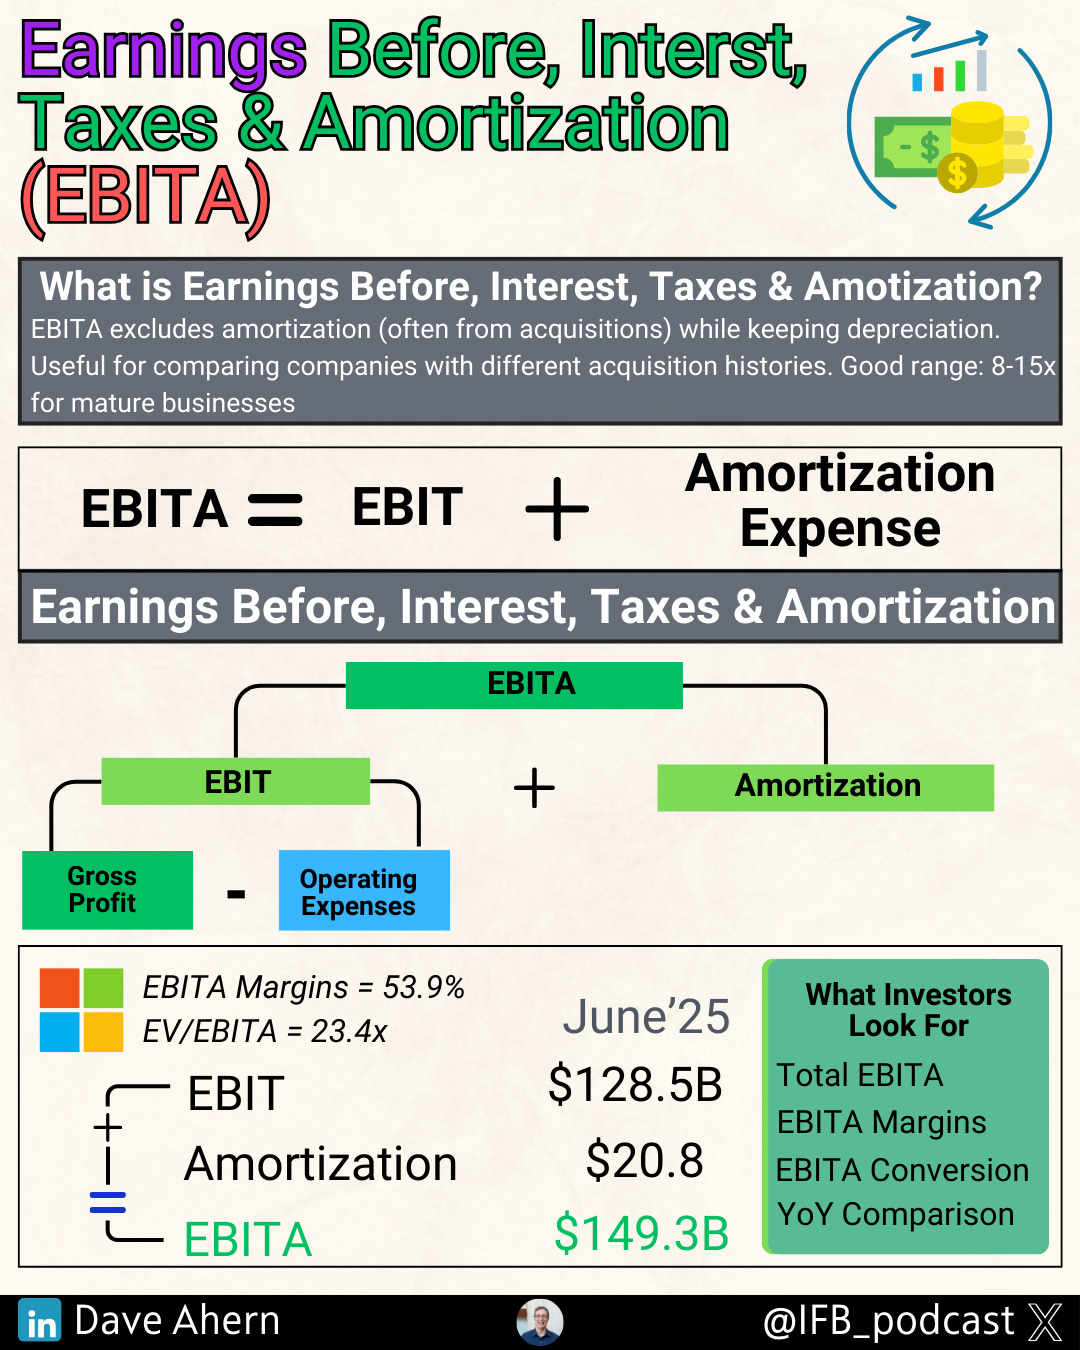
How to use it: Evaluate whether a company’s business model requires massive ongoing capex to maintain competitiveness. Capital-light businesses can grow with minimal reinvestment, allowing more cash to flow to shareholders. Capital-heavy businesses must constantly reinvest just to stand still. Good range: Look for companies spending less than 4-5% of revenue on maintenance capex. Compare capex to depreciation—if capex consistently exceeds D&A by 50%+ over many years, that’s capital intensity. Calculate “owner earnings” (net income + D&A - maintenance capex) to see true cash generation. Practical application: A software company with 40% operating margins and 2% capex/sales is far more attractive than a manufacturer with 40% margins but 15% capex/sales. The software company converts more profit into distributable cash. 4. Earnings Before Interest, Taxes, and Amortization (EBITA)EBITA measures operating profitability before financing decisions, tax structures, and amortization charges—but importantly, after depreciation. This metric accounts for the real wear-and-tear on physical assets while backing out the accounting treatment of intangible assets, often from acquisitions.
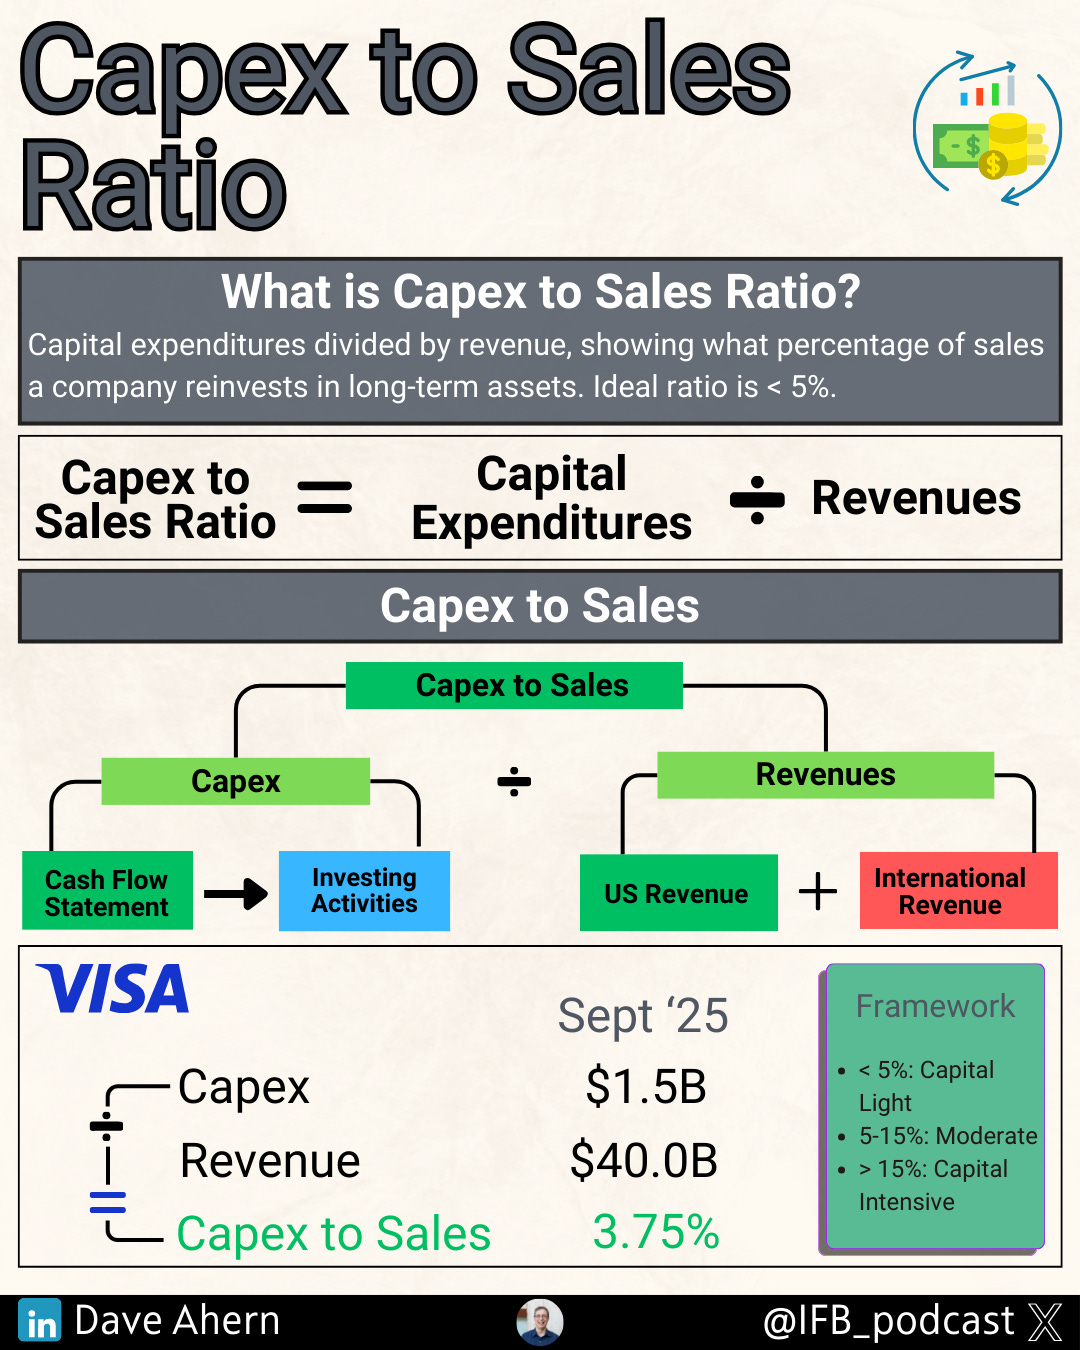
How to use it: EBITA is particularly valuable when comparing companies with different acquisition histories. Amortization of intangibles (goodwill, patents, customer relationships) represents accounting charges from past deals, not ongoing operational costs. By excluding amortization while retaining depreciation, you can assess operational performance while accounting for real capital consumption. Good range: EBITA margins vary by industry and software; asset-light businesses should target 25-35%, while industrials might target 12-18%. Compare against peers within the same sector. More importantly, track the trend: expanding EBITA margins signal operating leverage and improving efficiency. Practical application: A company that grew through acquisitions might show lower net income due to high amortization charges, but strong EBITA reveals solid underlying operations. Conversely, if EBITA looks good but free cash flow is weak, the business may be capital-intensive, with high depreciation, which is a red flag. Always reconcile EBITA back to cash flow to ensure profitability translates to actual cash generation. 5. Capex to Sales RatioThis ratio reveals how much capital a company must invest to generate each dollar of revenue, a critical metric for understanding capital efficiency and future cash flow potential.
How to use it: Calculate total capex divided by revenue to see capital intensity. Compare this ratio over time to spot trends (improving efficiency or increasing requirements) and against competitors to identify relative advantages. Break down into maintenance capex (keeping current operations running) and growth capex (funding expansion). Good range: Capital-light businesses operate with ratios under 5%. Capital-moderate businesses (many industrials) run 5-10%. Capital-heavy industries (utilities, telecom, heavy manufacturing) often exceed 10-15%. More important than the absolute number is the trend; declining capex/sales over time signals improving efficiency. Practical application: A company with 3% capex/sales and 20% operating margins converts 17% of revenue to operating profit before tax. A competitor with 12% capex/sales and the same margins only converts 8%. Over time, the capital-efficient business will vastly outperform. Use this ratio to identify hidden competitive advantages. Want the complete toolkit? You’ve just covered five foundational metrics that form the bedrock of business quality analysis. But we’re just getting started. Behind the paywall, you’ll get five more essential metrics:
These five infographics dive deeper into profitability analysis, financial health assessment, and insurance business metrics—plus a real-world application showing how Buffett used these exact principles to identify a compounding machine... Continue reading this post for free in the Substack app
|


0 💬:
Post a Comment