When most investors think about successful business model transformations, Netflix’s shift from DVDs to streaming dominates the conversation. But there’s another transformation story that remains equally impressive yet often flies under the radar: Adobe’s transition from selling perpetual software licenses to a subscription-based model. Between 2012 and 2024, Adobe executed one of the most successful subscription transitions in software history. The company moved from selling Creative Suite boxes for one-time payments to building a $21.51 billion recurring revenue machine through Creative Cloud and Document Cloud. More impressively, they did it while dramatically expanding margins and demonstrating genuine pricing power—the kind that separates truly great businesses from mediocre ones. For investors seeking to identify quality SaaS businesses with sustainable competitive advantages, understanding how Adobe achieved this remains invaluable. Even better, we can use Adobe’s financial metrics to develop a framework for distinguishing companies with real pricing power from those simply raising prices and hoping customers don’t notice. In today’s post, we will learn:
Okay, let’s dive in and learn more about how Adobe built one of the highest-quality subscription businesses in software. Understanding Adobe’s Subscription Transition: The NumbersLet’s start with the transformation itself. I know business model transitions sound complicated, but Adobe’s story remains surprisingly straightforward when you examine the actual financial statements.
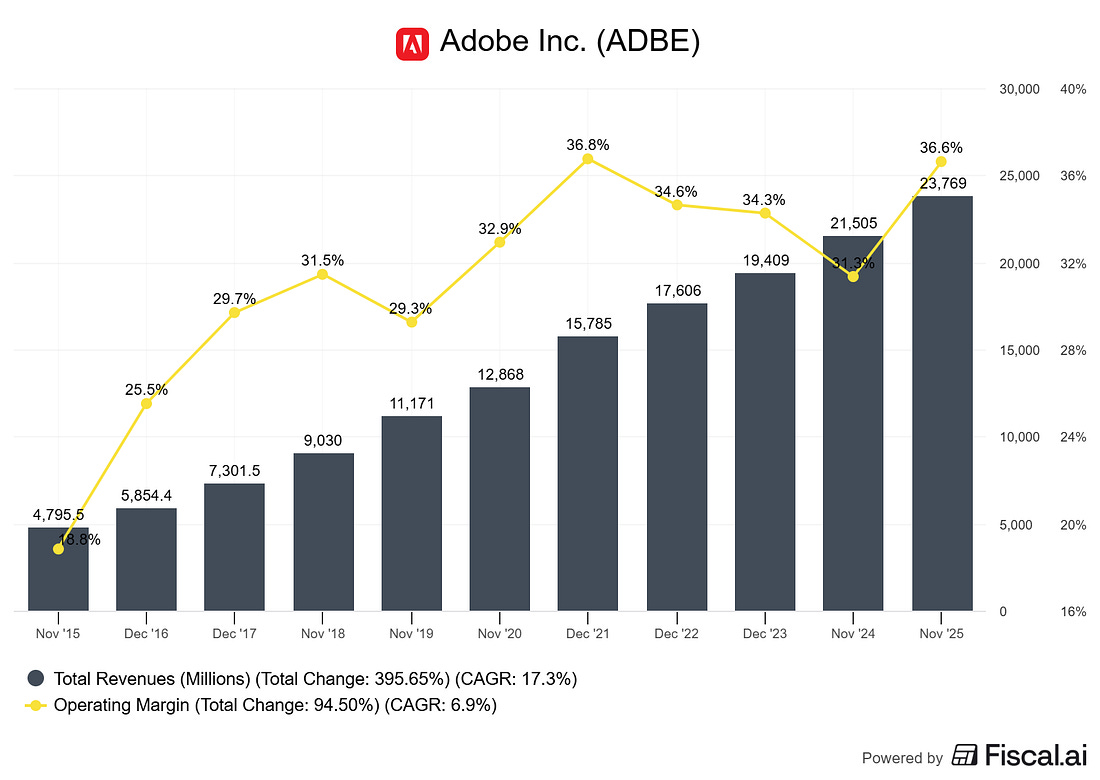
The Pre-Transition Era (Before 2013)Before 2013, Adobe operated like most traditional software companies. Customers purchased Creative Suite, a collection of professional tools such as Photoshop, Illustrator, and InDesign, for a one-time payment, typically $1,299 to $2,599, depending on the package. Adobe recognized the revenue immediately but faced a persistent challenge: persuading customers to upgrade every 12-18 months when new versions were released. This created a lumpy, unpredictable business model. Revenue spiked when major releases hit the market, then fell as customers waited for the next version. Customer lifetime value remained difficult to predict. And frankly, many customers simply skipped upgrades, using older versions for years. The Pivot to Creative Cloud (2013-2015)In 2013, Adobe made the bold decision to discontinue the Creative Suite and shift to Creative Cloud subscriptions. Instead of paying $2,000+ upfront, customers now pay $49.99 per month (or $599.88 annually) for access to the entire creative suite, always updated. Now, before you think “Of course that worked, it’s cheaper!”—that’s actually not the key insight here. What made this transition brilliant wasn’t the pricing. The genius was in what Adobe recognized about their customer base and their ability to create genuine value through the subscription model. The Financial Results: What Actually HappenedLet’s look at Adobe’s fiscal 2024 results for the fiscal year ended November 29, 2024:
Compare this to fiscal 2020 (four years earlier):
That’s a 67% increase in total revenue over four years, or approximately 14% compounded annual growth. But here’s what makes this remarkable: Adobe achieved this growth while dramatically expanding operating margins. Fiscal 2024 Operating Margin:
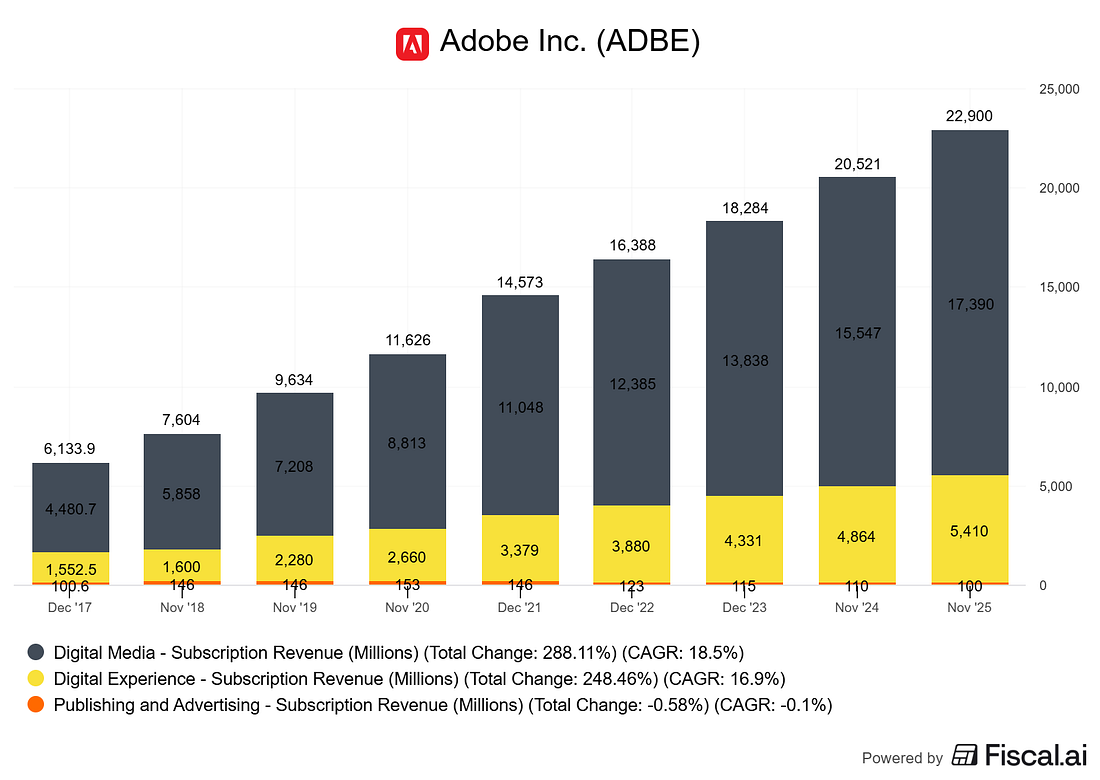
For context, when Adobe was selling perpetual licenses back in 2012, their operating margins hovered around 25-30% on a GAAP basis. They’ve expanded margins by 600+ basis points while growing revenue 67% over four years. Not too hard to see why investors might find this attractive, was it? The Digital Media Segment: Where the Magic HappensLet’s focus on Adobe’s Digital Media segment, where we can see the subscription transition most clearly. From their fiscal 2024 10-K: Digital Media Segment Revenue: $15.54 billion (fiscal 2024)
This segment includes two main businesses:
Adobe reported that Digital Media Annualized Recurring Revenue (ARR) exited fiscal Q4 2024 at $17.33 billion, broken down as:
Now, what’s particularly telling is the Net New ARR added in Q4 2024: $578 million in a single quarter. This metric shows Adobe isn’t just maintaining its existing subscription base; it’s accelerating growth within it. The formula for understanding ARR growth is simple: Ending ARR = Beginning ARR + Net New ARR - Churn Adobe’s minimal disclosure of churn (they don’t break it out explicitly in public filings) indicates it remains very low. Companies with high churn rates are often required to disclose or address it in management commentary. Adobe’s silence on this front suggests its retention rates stay exceptionally strong. Genuine Pricing Power: How to Identify ItOkay, now we get to the critical question: How do we distinguish between a company with genuine pricing power (like Adobe) versus a company just raising prices and hoping customers don’t flee?
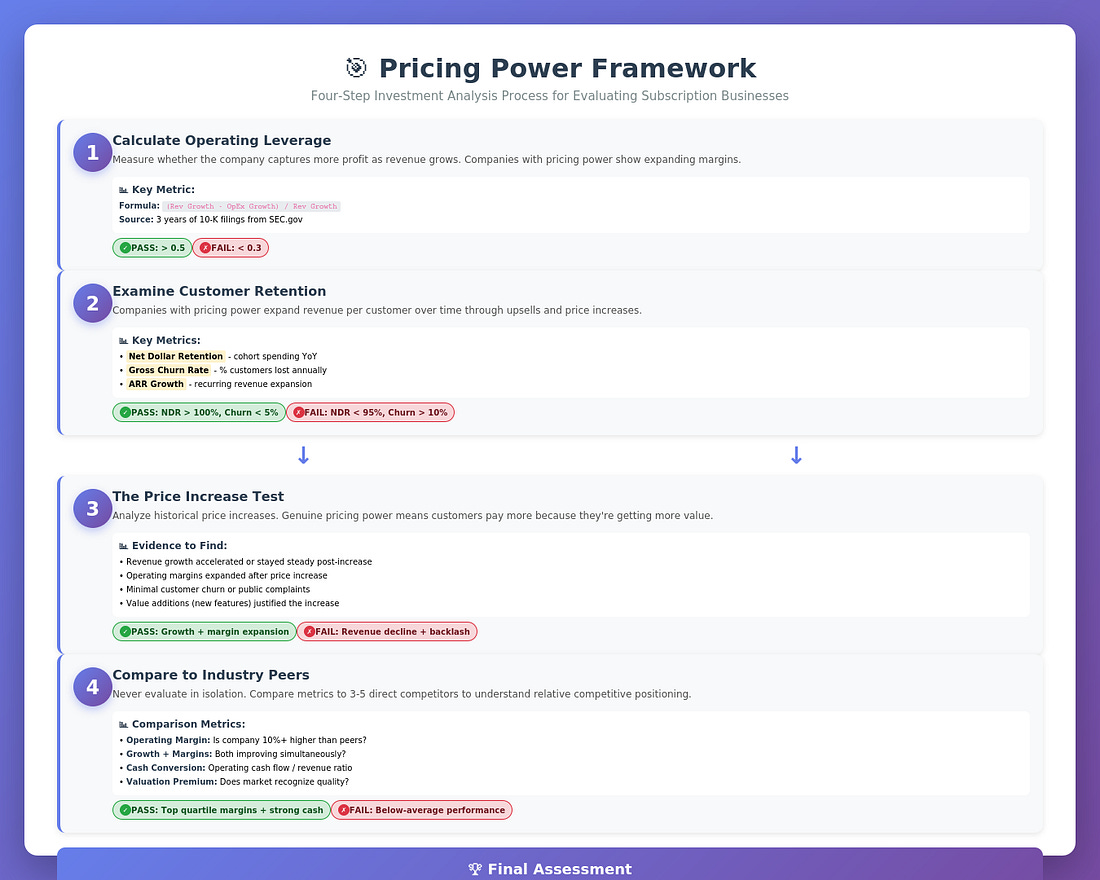
This matters enormously to investors because pricing power directly impacts long-term returns. Companies without pricing power eventually get commoditized, face margin pressure, and deliver mediocre returns. Companies with genuine pricing power can grow intrinsic value steadily over decades. Here’s the framework I use to evaluate pricing power in subscription businesses: 1. Operating Leverage During Price IncreasesCompanies with genuine pricing power show expanding margins when they raise prices because their costs don’t increase proportionally. The formula looks like this: Operating Leverage Test = (Revenue Growth - Operating Expense Growth) / Revenue Growth
For Adobe in fiscal 2024:
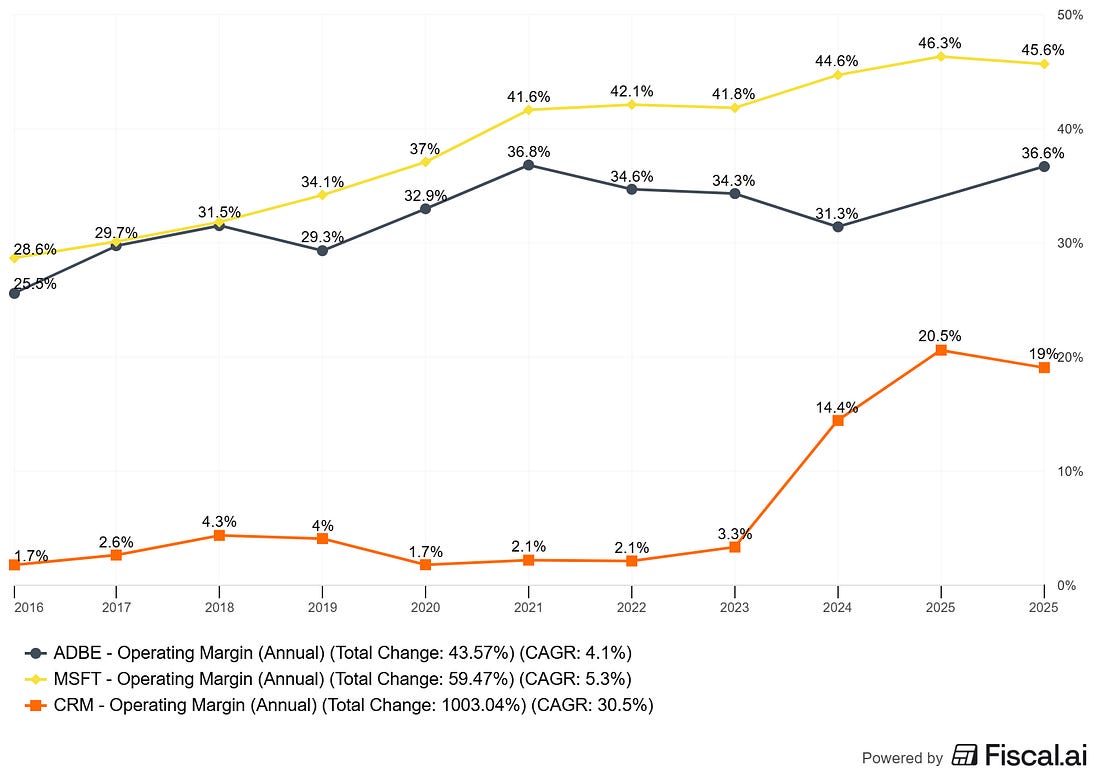
This demonstrates positive operating leverage. Adobe is capturing a larger share of each incremental dollar as profit, indicating that its price increases are sticky and that customers don’t require proportionally more support or marketing to retain. Let’s compare this to the high-quality SaaS peers: Microsoft Fiscal 2024 (year ended June 30, 2024):
Microsoft showed even stronger operating leverage than Adobe, which makes sense given their scale and market position. Salesforce Fiscal 2024 (year ended January 31, 2024):
Salesforce showed solid revenue growth, but its operating margins remain well below those of Adobe and Microsoft, suggesting less pricing power or higher customer acquisition costs. Remember that Salesforce also underwent significant restructuring in fiscal 2024, which compressed margins. 2. Customer Retention and Expansion MetricsCompanies with pricing power don’t just retain customers, they expand revenue per customer over time. I look for:
Adobe doesn’t publicly report net dollar retention, but we can infer it from its ARR growth and new customer acquisition rates. Given that Digital Media ARR grew $2.07 billion year-over-year (from $15.26B to $17.33B) and Adobe added new customers, we can estimate their net dollar retention likely exceeds 105-110%. For comparison:
The pattern remains clear: high-quality SaaS businesses maintain net dollar retention above 100%, meaning existing customers spend more each year even before new customer acquisition. 3. The Ultimate Test: Willingness to Pay MoreHere’s the test I find most revealing: What happens when the company raises prices? Adobe has raised Creative Cloud prices multiple times over the past decade. The All Apps subscription went from $49.99/month in 2013 to $59.99/month today (some regional variations apply). That’s approximately a 20% increase over 11 years, or about 1.7% annually, roughly in line with inflation. But here’s the thing: Adobe didn’t just raise prices on the same product. They added tremendous value:
When customers pay more and get significantly more value, that’s genuine pricing power. When they pay more and get the same thing they got last year, that’s a price increase born from desperation or a misunderstanding of your competitive position. Comparing Adobe to Other SaaS Leaders: A FrameworkLet me show you how Adobe stacks up against other premier SaaS businesses using metrics you can find in any company’s 10-K. This comparison helps us understand what truly excellent SaaS economics look like.
The Key Metrics to Compare:
Here’s the data from fiscal 2024 SEC filings: Adobe (Fiscal Year ended November 29, 2024)
Microsoft (Fiscal Year ended June 30, 2024)
Salesforce (Fiscal Year ended January 31, 2024)
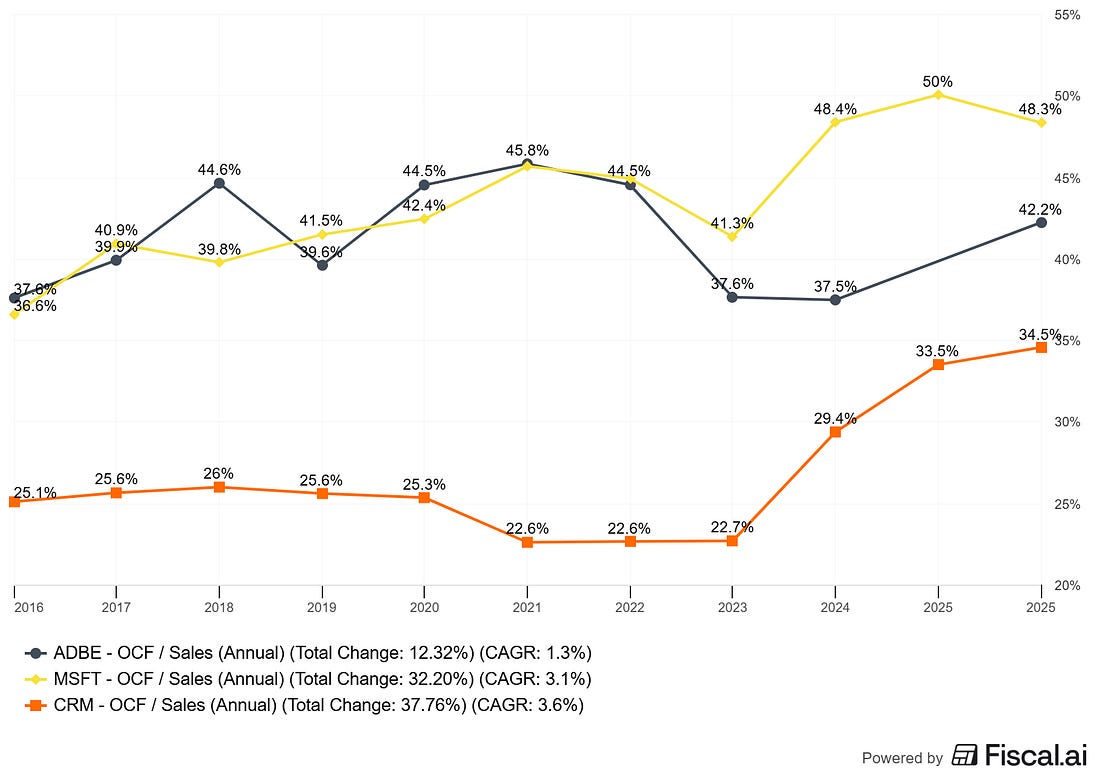
What do we learn from this comparison? First, Adobe and Microsoft have higher operating margins than Salesforce, suggesting stronger pricing power and more efficient operations. Both companies convert roughly 45-47% of revenue to operating income (non-GAAP), while Salesforce converts about 30%. Second, cash generation tells a similar story. Adobe and Microsoft convert 40-48% of revenue to operating cash flow, while Salesforce converts approximately 29%. This matters because cash generation, not accounting earnings, determines intrinsic value over time. Third, all three companies maintain extremely high subscription revenue percentages (93%+), which creates revenue predictability. This is the foundation of quality SaaS businesses. Building Your Own Pricing Power AnalysisOkay, let’s make this practical. You’re evaluating a subscription business and want to determine if it has genuine pricing power. Here’s the step-by-step framework: Step 1: Calculate Operating LeveragePull three years of 10-K filings from SEC.gov. You need:
The formula: Operating Leverage = (Year 3 Operating Income - Year 1 Operating Income) / (Year 3 Revenue - Year 1 Revenue) What it tells you:
Adobe Example (Fiscal 2024 vs Fiscal 2022): Fiscal 2024: Revenue $21.51B, Operating Income $6.74B (GAAP) Fiscal 2022: Revenue $17.61B, Operating Income $5.56B Operating Leverage = ($6.74B - $5.56B) / ($21.51B - $17.61B) Operating Leverage = $1.18B / $3.90B = 0.30 Wait, that seems low! What happened? This reminds us that GAAP operating income includes stock-based compensation and other non-cash charges. Let’s look at non-GAAP operating income: Fiscal 2024: Non-GAAP Operating Income $10.02B Fiscal 2022: Non-GAAP Operating Income $7.95B Operating Leverage = ($10.02B - $7.95B) / ($21.51B - $17.61B) Operating Leverage = $2.07B / $3.90B = 0.53 Still not >1.0, but much healthier. This indicates that Adobe is investing heavily in R&D and sales to drive future growth, temporarily compressing the operating leverage metric. But the trend remains positive, margins are expanding. Step 2: Examine Customer Retention EconomicsLook for these metrics in earnings calls, investor presentations, or 10-K filings:
Adobe doesn’t disclose all of these publicly, but you can often find them for other companies. For instance, Salesforce discusses RPO (Remaining Performance Obligation) growth, which serves as a proxy for ARR growth. Step 3: The Price Increase TestThis requires reading through several years of 10-Ks and earnings transcripts. Look for:
For Adobe, we see price increases accompanied by:
This combination signals genuine pricing power. Step 4: Compare to Industry PeersNever evaluate a company in isolation. Compare your target’s metrics to 3-5 peers in the same industry. Look for:
For Adobe, we compared it to Microsoft and Salesforce and found that Adobe sits firmly in the “high quality” tier with margins and cash generation comparable to Microsoft (arguably the gold standard) and superior to Salesforce. The Investment Implication: Quality CompoundsHere’s why this all matters for investors. Quality subscription businesses with genuine pricing power compound intrinsic value differently than commodity businesses. Let’s think through a simple example. Imagine two software companies, both generating $1 billion in revenue today: Company A (Genuine Pricing Power - Adobe-like profile):
Company B (Weak Pricing Power - Commodity profile):
After 10 years: Company A:
Company B:
Company A generated 2X the cash flow despite identical revenue growth. This is the power of pricing compounding over time. Adobe’s Moats: Why the Pricing Power ExistsI know we’ve been focused on metrics, but we should briefly discuss why Adobe can exercise pricing power. After all, identifying quality businesses means understanding their competitive advantages (or “moats,” as Buffett calls them).
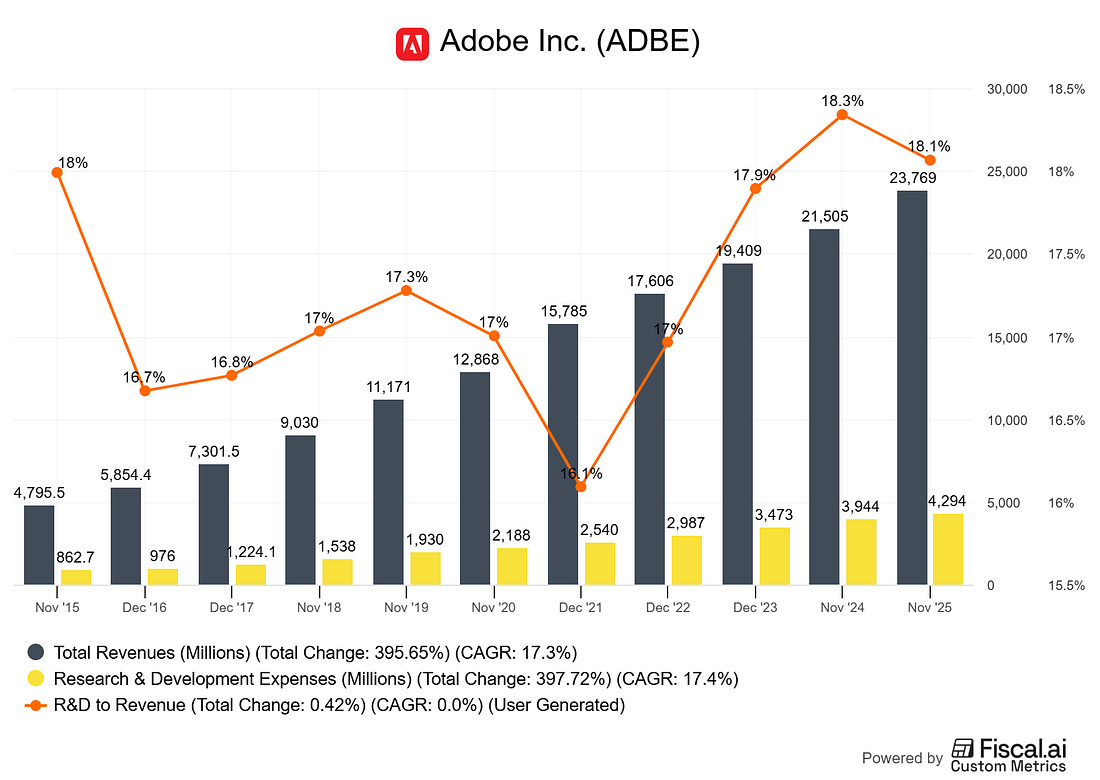
Adobe’s pricing power stems from several sources: 1. Switching Costs Creative professionals build entire workflows around Adobe’s tools. Their muscle memory, keyboard shortcuts, file formats, and existing project libraries all lock them into the Adobe ecosystem. Switching to a competitor like Affinity Photo or GIMP means:
These switching costs give Adobe remarkable latitude on pricing. 2. Network Effects Adobe’s file formats (PSD, AI, INDD) have become industry standards. When a photographer sends a PSD file to a graphic designer, both parties need Adobe tools to collaborate effectively. This creates a network effect: as more professionals use Adobe, the more valuable Adobe becomes to everyone else. 3. Content Library and Integration Creative Cloud subscribers get access to Adobe Stock, fonts, cloud storage, and templates. These additional services create stickiness beyond just the software tools themselves. Customers aren’t just buying Photoshop—they’re buying an entire creative ecosystem. 4. Continuous Innovation Adobe invests heavily in R&D ($3.43 billion in fiscal 2024, or 16% of revenue). They’re not standing still. Adobe Firefly (generative AI), enhanced collaboration features, and regular app improvements deliver meaningfully more value to customers each year. This justifies gradual price increases. Investor Takeaway: The Framework in ActionLet me bring this all together with actionable guidance for evaluating subscription businesses: The Quality SaaS Checklist: ✓ Subscription revenue >85% of total revenue (predictability) ✓ Operating margins >35% (non-GAAP) (economic quality) ✓ Operating leverage >0.5 when expanding (pricing power) ✓ Operating cash flow margin >35% (cash generation) ✓ Net dollar retention >100% (customer satisfaction) ✓ Identifiable moats (switching costs, network effects, or unique IP) Adobe’s Scorecard:
Adobe scores 6/6 on our quality checklist. Where to Find the Data: All the metrics I’ve discussed come from publicly available sources:
What to Watch Going Forward: For Adobe specifically, I’d monitor:
Remember: The bottom line is that companies with genuine pricing power, such as Adobe, Microsoft, and, to a somewhat lesser extent, Salesforce, can compound intrinsic value at rates that commodity businesses cannot match. These are the businesses that create wealth for patient, long-term investors. When you’re analyzing a subscription business, don’t just look at revenue growth. Ask: Can this company raise prices without losing customers? Are margins expanding as the business scales? Is cash generation strong and improving? If the answer to all three questions is “yes,” you might have found a quality compounder worth holding for decades. With that, we will wrap up our discussion today. As always, thank you for taking the time to read today’s post, and I hope you find something of value in your investing journey. If I can be of further assistance, please don’t hesitate to reach out. Until next time, take care and be safe out there, Dave You're currently a free subscriber to School of Investing. For the full experience, upgrade your subscription.
|

No comments:
Post a Comment