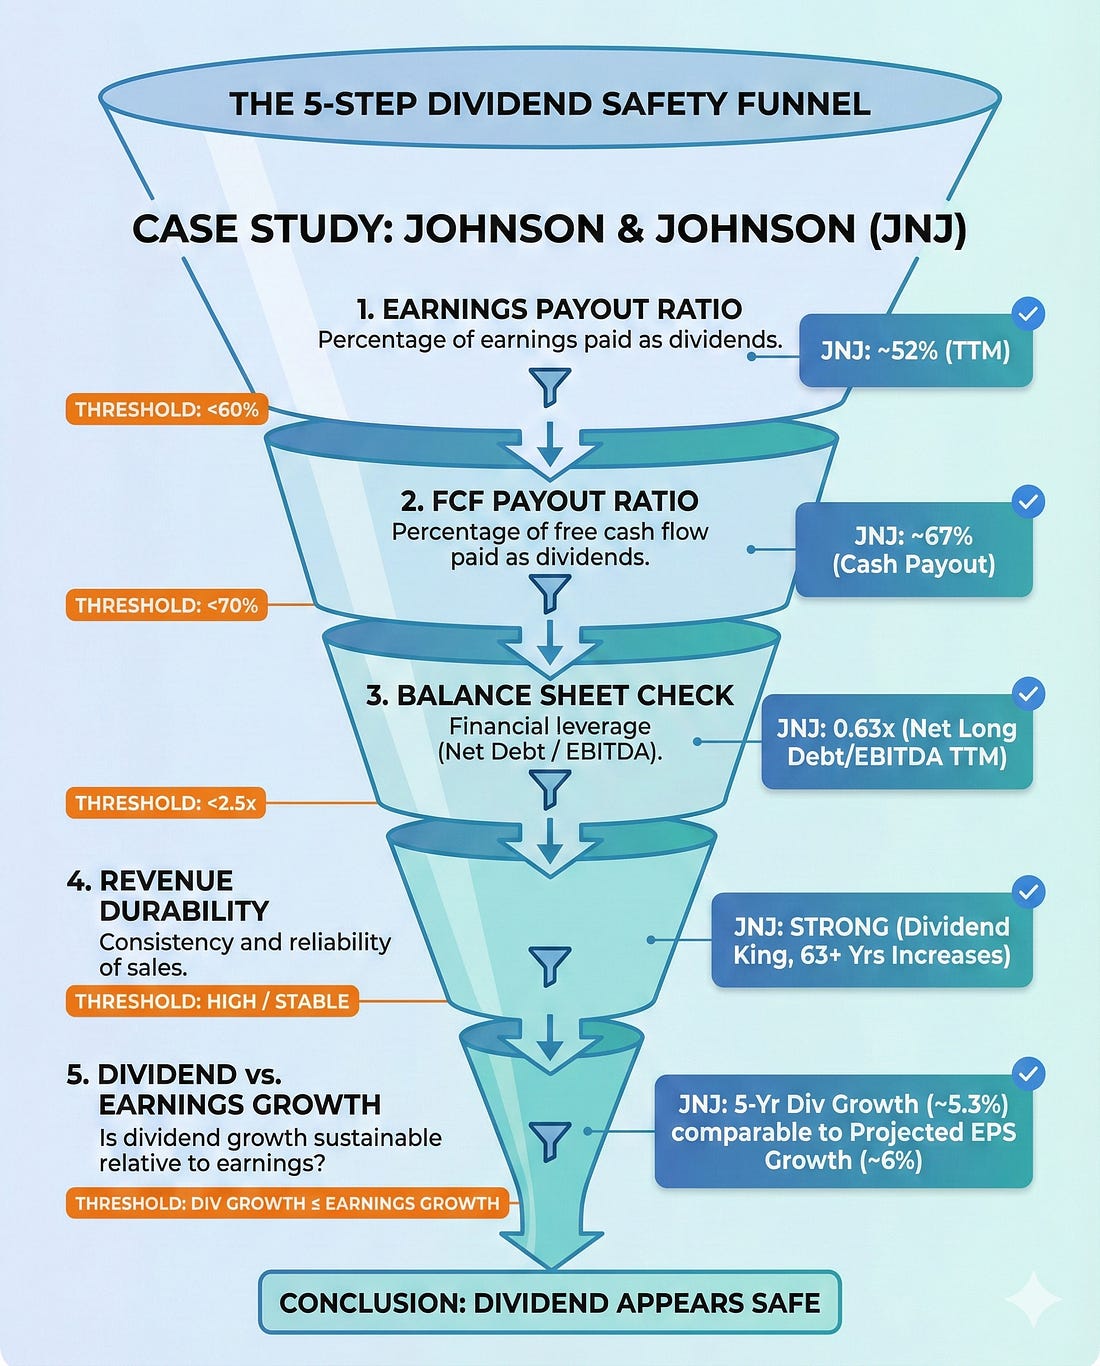
How to Evaluate Dividend Safety Using Financial StatementsA Five-Step Framework with Johnson & Johnson (JNJ) as Our Case StudyJohnson & Johnson has increased its dividend for 62 consecutive years. That is a streak stretching back to 1963, through recessions, wars, pandemics, and everything in between. But here is the question every dividend investor should ask: does the streak tell you the dividend is safe today, or just that it was safe yesterday? A long dividend track record is comforting. It is not, however, a guarantee. Companies like General Electric and AT&T once seemed like untouchable dividend payers, and both eventually cut their dividends. The track record only tells you the past. Financial statements tell you the future. In today’s post, I’m going to walk you through a five-step framework for evaluating dividend safety using a company’s financial statements. We will use Johnson & Johnson (JNJ) as our case study, pulling actual numbers from their fiscal year 2024 10-K filed with the SEC in February 2025. By the end, you will have a repeatable process you can apply to any dividend stock in your portfolio. Here is what we will cover: • Step 1: Start with the Earnings Payout Ratio • Step 2: Upgrade to the Free Cash Flow Payout Ratio • Step 3: Examine the Balance Sheet for Debt Safety • Step 4: Assess Revenue Durability and Earnings Trends • Step 5: Check the Dividend Growth Rate Against Earnings Growth • Common Mistakes: What This Framework Cannot Tell You
Why Dividend Safety Matters More Than YieldBefore we dig into the framework, I want to address something important. Too many investors chase the highest yield without asking whether the company can actually sustain it. A 7% yield sounds wonderful until the company slashes it by 50% and the stock drops 30% overnight.
Dividend safety is about one core question: can the company comfortably afford to pay (and grow) its current dividend from the cash its operations generate? If the answer is yes, you likely have a quality dividend stock. If the answer is no, or barely, you are sitting on a ticking clock. Warren Buffett put it simply in his 1992 shareholder letter: the best business is one that can employ large amounts of capital at high rates of return. Companies that generate strong returns on capital have the surplus cash needed to pay reliable, growing dividends without straining the business. With that context, let’s build our framework. Step 1: Start with the Earnings Payout RatioThe earnings payout ratio is the simplest place to begin. It tells you what percentage of a company’s net earnings are being paid out as dividends. Formula: Earnings Payout Ratio = Dividends Per Share / Earnings Per Share Let’s run this for JNJ using their fiscal 2024 results, which you can find in their 10-K filing on sec.gov (filed February 13, 2025, for the period ending December 29, 2024). Johnson & Johnson reported GAAP diluted earnings per share of $5.79 for fiscal 2024. Their annual dividend was $4.96 per share ($1.24 per quarter). That gives us: Earnings Payout Ratio = $4.96 / $5.79 = 85.7% At first glance, that 85.7% payout ratio looks alarmingly high. If JNJ is paying out almost 86 cents of every dollar it earns, there is almost no cushion, right? Not so fast. This is where many investors make their first mistake. GAAP net earnings for fiscal 2024 were heavily impacted by one-time charges, including approximately $1.6 billion in acquired in-process research and development (IPR&D) charges from acquisitions throughout the year. These are non-cash charges that reduce reported earnings but do not affect the company’s cash generation ability. JNJ’s adjusted earnings per share, which strips out these special items plus intangible amortization, came in at $9.98 for fiscal 2024. Using adjusted EPS: Adjusted Earnings Payout Ratio = $4.96 / $9.98 = 49.7% That is a much more comfortable picture. A payout ratio under 50% on adjusted earnings means JNJ is retaining about half its earnings for reinvestment, debt repayment, and acquisitions. What to look for: I generally want to see an earnings payout ratio below 60% for mature companies and below 40% for growth companies. Above 75%, you should start asking tough questions. But always dig deeper than GAAP earnings, which brings us to Step 2. Step 2: Upgrade to the Free Cash Flow Payout RatioEarnings are an accounting construct. Cash is real. That is why the free cash flow payout ratio is the more important metric for dividend safety. Formula: FCF Payout Ratio = Total Dividends Paid / Free Cash Flow
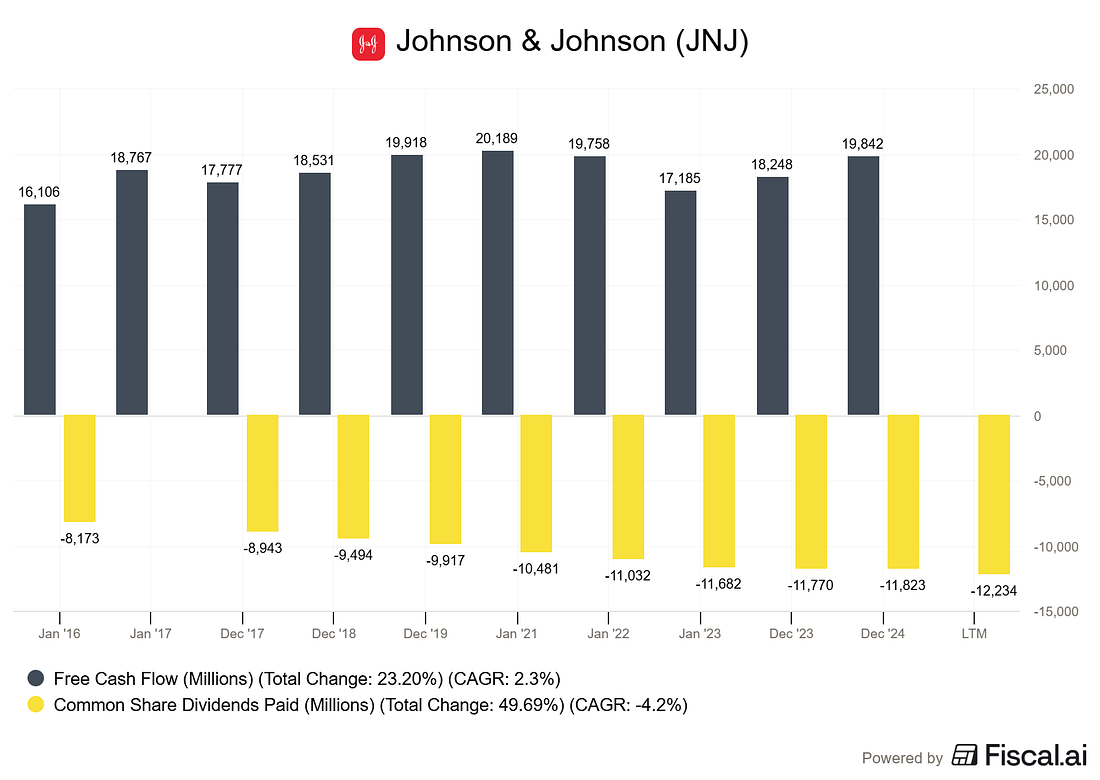
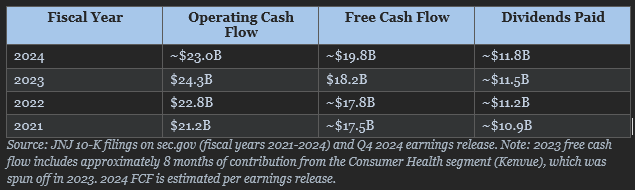
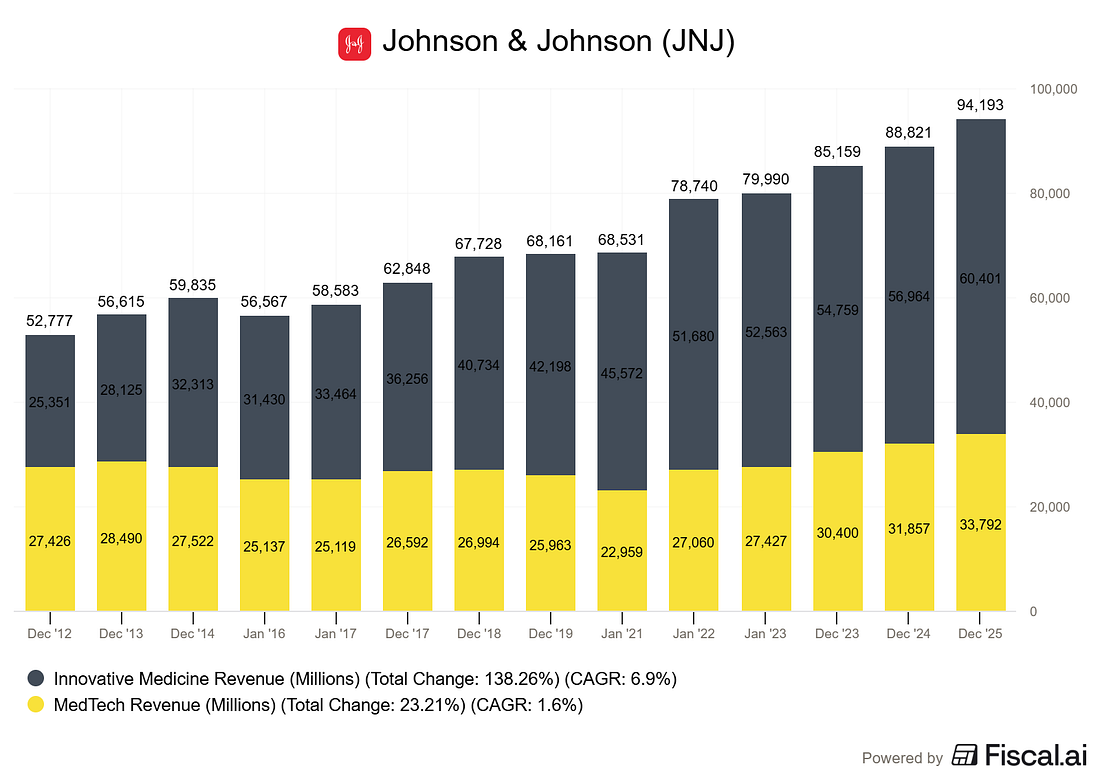
Free cash flow equals operating cash flow minus capital expenditures. It represents the actual cash left over after the company has funded its operations and maintained its asset base. This is the cash available to pay dividends, buy back shares, reduce debt, or make acquisitions. For JNJ’s fiscal 2024, the company reported estimated free cash flow of approximately $19.8 billion, according to their Q4 2024 earnings release. Their total dividend payments for the year were approximately $11.8 billion (based on approximately 2.41 billion shares outstanding at $4.96 per share). FCF Payout Ratio = $11.8 billion / $19.8 billion = 59.6% A free cash flow payout ratio around 60% is solid for a company of JNJ’s size and maturity. It means the company is generating nearly $8 billion in excess cash after paying dividends. That cash cushion provides flexibility for acquisitions (JNJ spent heavily on acquisitions in 2024, including Shockwave Medical and V-Wave), debt management, and continued R&D investment. Let’s put this in context by looking at JNJ’s free cash flow history:
The pattern here is reassuring. JNJ consistently generates enough free cash flow to cover its dividend payments with a meaningful buffer. Even in a year of heavy acquisition spending, operating cash flow remains robust. What to look for: I want the free cash flow payout ratio below 70% for stable companies and below 50% for companies in cyclical industries. Consistency matters as much as the absolute number. If a company’s FCF bounces wildly from year to year, a single-year snapshot is not enough. Step 3: Examine the Balance Sheet for Debt SafetyA company can afford its dividend today but be sitting on a mountain of debt that will eventually force a cut. This is why the balance sheet matters for dividend safety. Heavy debt loads mean heavy interest payments, and those interest payments get first priority over dividends. There are two ratios I focus on: Net Debt to EBITDA: This tells you how many years of earnings it would take to pay off the company’s net debt. Lower is better. Interest Coverage Ratio: This measures how comfortably the company can cover its interest payments from operating income. Higher is better. Johnson & Johnson’s fiscal 2024 10-K shows total debt of approximately $48.9 billion (including short-term debt of $2.5 billion and long-term debt, notes, and leases totaling roughly $46.4 billion). Against this, JNJ held approximately $24.1 billion in cash and cash equivalents at year end. That puts net debt at roughly $24.8 billion. Using an estimated EBITDA of approximately $28 billion (operating income plus depreciation and amortization): Net Debt / EBITDA = $24.8B / ~$28B = approximately 0.9x A Net Debt/EBITDA ratio under 1.0x is excellent. It means JNJ could theoretically pay off all its net debt in less than one year of EBITDA. For context, I start getting cautious above 2.5x and concerned above 3.5x for most industries. For interest coverage, JNJ paid approximately $2.0 billion in interest during fiscal 2023 (per the supplemental cash flow data). Operating income for fiscal 2024 was approximately $19.8 billion, giving: Interest Coverage = $19.8B / ~$2.0B = approximately 10x An interest coverage ratio of 10x means JNJ earns ten dollars in operating income for every dollar of interest it pays. That is an extremely comfortable margin. I generally want to see interest coverage above 5x for dividend safety, and JNJ clears that bar handily. One additional point worth noting: JNJ maintains a AAA credit rating from Standard & Poor’s, one of only two U.S. companies to hold that distinction (the other being Microsoft). That rating reflects the market’s confidence in JNJ’s ability to service its debt, which in turn supports the dividend. What to look for: Net Debt/EBITDA below 2.5x and Interest Coverage above 5x. Also check the credit rating if available. Investment-grade ratings (BBB or better) are a strong signal of financial stability. Step 4: Assess Revenue Durability and Earnings TrendsPayout ratios and debt metrics give you a snapshot. But dividends are paid over decades, so you need to understand whether the company’s revenue base is durable enough to keep funding the dividend long term. For this step, I look at three things: • Revenue trend: Is revenue growing, flat, or declining? • Revenue concentration: Is the company overly dependent on a single product or customer? • Earnings quality: Are adjusted earnings consistently close to GAAP earnings, or is there a persistent gap? Johnson & Johnson’s fiscal 2024 revenue was $88.8 billion, up 4.3% from $85.2 billion in 2023. Excluding currency impacts, operational growth was 5.9%. Excluding the declining COVID-19 vaccine, operational growth was 7.0%. That is solid top-line growth for a company of this scale.
Revenue is split across two segments: Innovative Medicine (pharmaceuticals) at $57.0 billion and MedTech (medical devices) at $31.9 billion. This diversification matters. If one segment stumbles, the other can help cushion the impact on overall cash flows and the dividend. However, there is a notable risk to flag. JNJ’s two largest products, DARZALEX and STELARA, together account for approximately 25% of total revenue (13.1% and 11.7% respectively, per the 10-K). STELARA faces biosimilar competition beginning in 2025, which the company acknowledges will impact sales. This is exactly the kind of revenue concentration risk that dividend investors need to monitor. The good news is that JNJ’s pipeline includes strong growth drivers like TREMFYA (which recently received expanded indications), CARVYKTI in oncology, and ERLEADA in prostate cancer. The company guided for 2025 operational sales growth of 2.5% to 3.5% and adjusted operational EPS of $10.75 to $10.95, reflecting strong growth of 8.7% at the midpoint even while absorbing the STELARA headwind. What to look for: Steady or growing revenue over 5+ years, no single product or customer representing more than 20% of revenue (or if so, strong pipeline replacement), and adjusted earnings that trend in the same direction as GAAP earnings over time. Step 5: Check Dividend Growth Against Earnings GrowthThe final step ties everything together. A safe dividend is one that grows slower than earnings over time. If the dividend grows faster than earnings, the payout ratio is creeping upward, and eventually the company runs out of room.
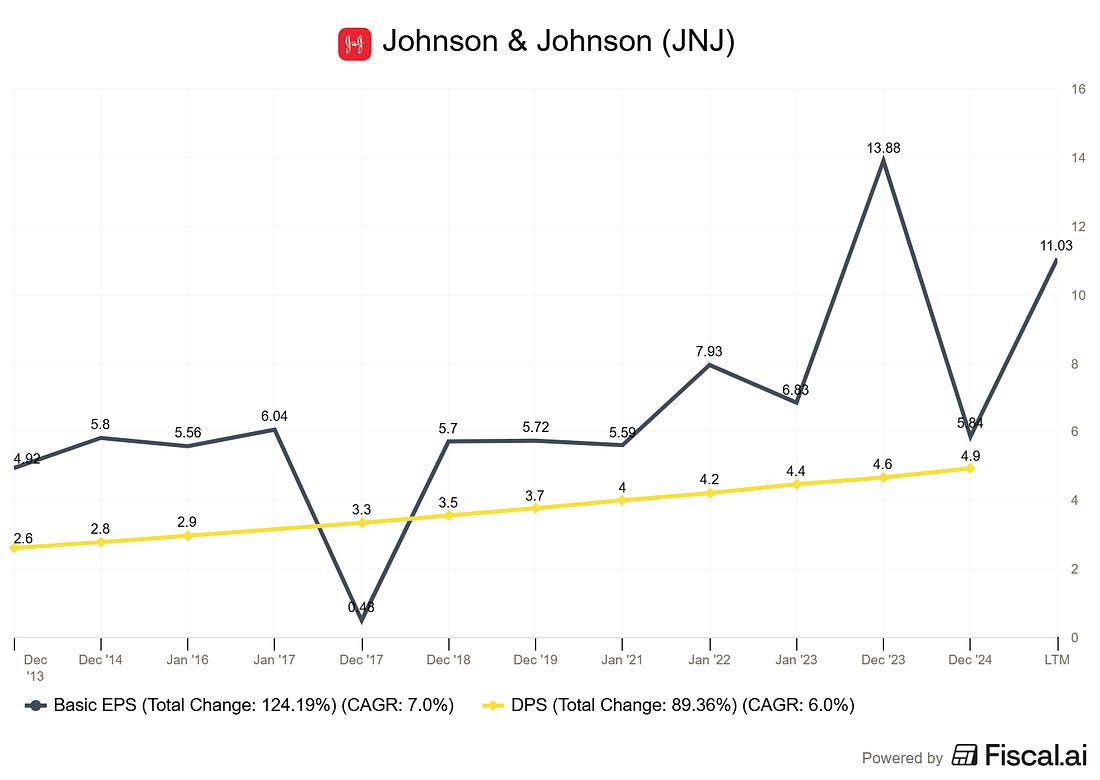
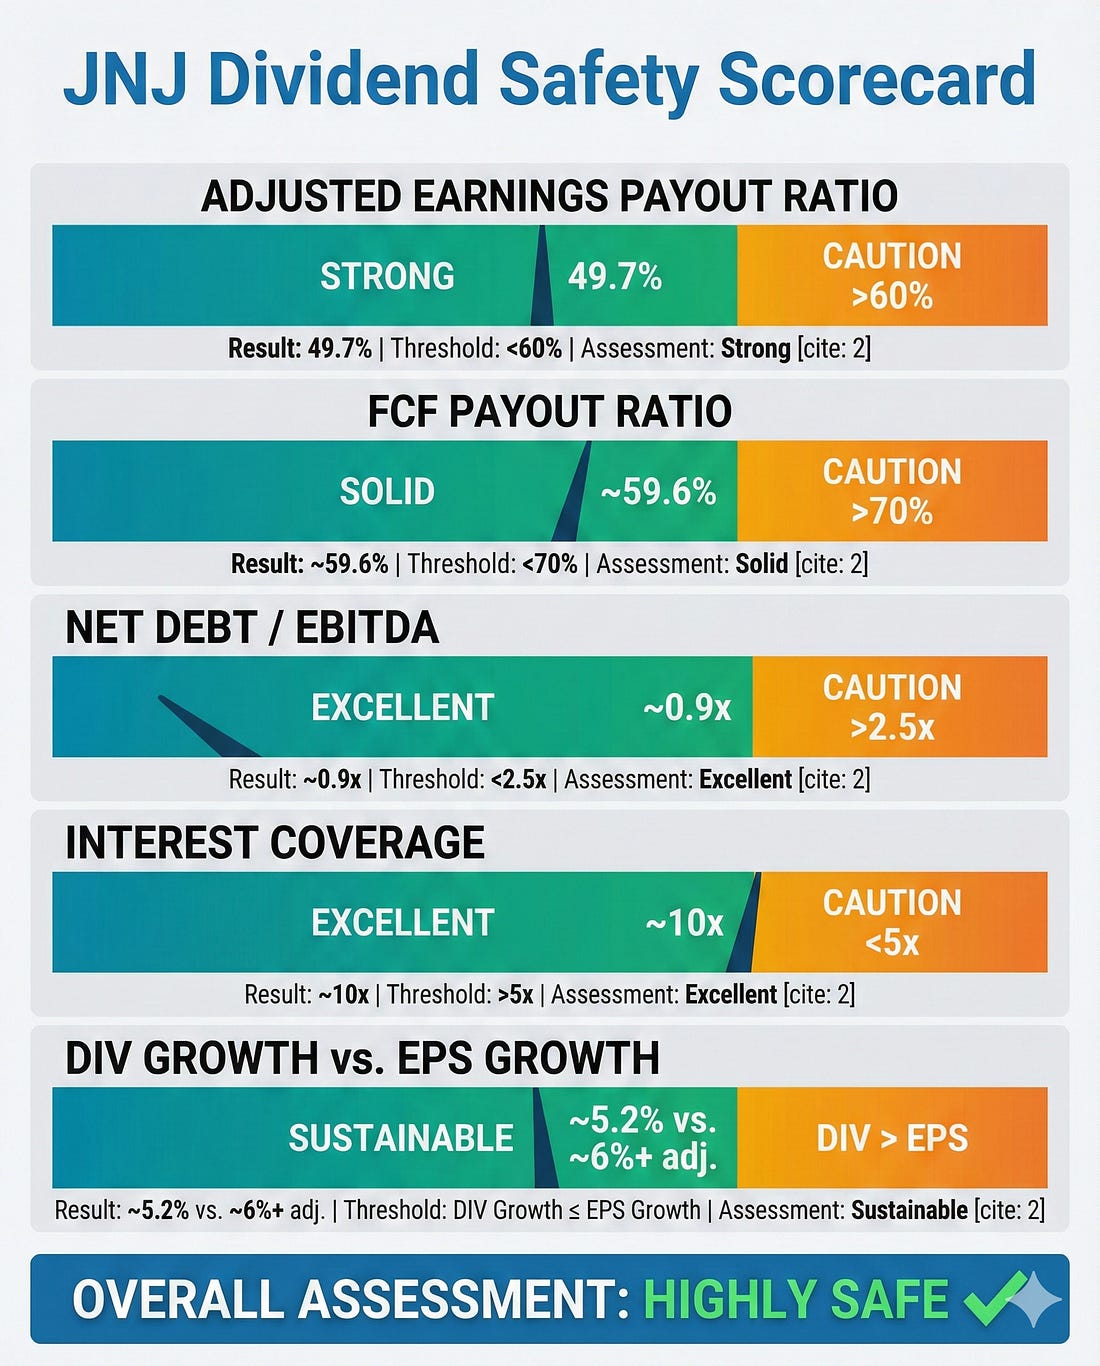
JNJ raised its quarterly dividend by 4.2% in April 2024, from $1.19 to $1.24 per share, marking the 62nd consecutive year of increases. Over the last five years, JNJ’s dividend has grown at a compound annual rate of approximately 5.2%. Compare that to adjusted EPS growth. JNJ’s adjusted EPS was $9.98 in 2024 versus $9.92 in 2023, representing modest growth of 0.6% on a reported basis. However, looking at the 2025 guidance midpoint of $10.85 in adjusted operational EPS, that represents growth of 8.7% over 2024. The key insight: in any single year, dividend growth may outpace or lag earnings growth due to special items, currency effects, or business cycle timing. What matters is the longer-term pattern. Over the last decade, JNJ’s dividend growth rate of approximately 6% has broadly tracked its adjusted earnings growth, keeping the payout ratio stable. What to look for: Over a 5-to-10-year period, dividend growth should be at or below adjusted earnings growth. If the dividend is growing at 8% annually but earnings are only growing at 3%, you have a problem that will eventually catch up. Putting It All Together: The JNJ Dividend Safety ScorecardHere is our complete framework applied to Johnson & Johnson:
Overall assessment: JNJ’s dividend scores well across all five dimensions. The earnings and FCF payout ratios leave adequate room, the balance sheet is conservatively managed (AAA credit rating), revenue is growing, and dividend growth is tracking earnings growth. The primary risk to monitor is the STELARA patent cliff and whether pipeline products can offset the lost revenue. Common Mistakes to AvoidBefore you apply this framework to your own portfolio, here are the pitfalls I see investors fall into most often. Relying solely on GAAP earnings. As we saw with JNJ, one-time charges can make the GAAP payout ratio look terrifying when the underlying business is healthy. Always check adjusted earnings alongside GAAP, but make sure the company’s adjustments are reasonable and not hiding real problems. Ignoring the balance sheet. A company can have a low payout ratio and still cut its dividend if debt maturities force cash toward debt repayment. Always check the debt maturity schedule in the 10-K notes. JNJ’s debt is well-laddered with maturities extending out decades, which reduces refinancing risk. Treating the dividend streak as a guarantee. A 62-year streak is impressive, but management teams change, industries evolve, and competitive positions erode. The streak is an input, not the conclusion. Use it as a starting point, then verify with the financial data. Chasing yield over safety. If a stock yields 6% and your framework shows the payout ratio is 95% and debt is climbing, that 6% yield is a warning sign, not a buying signal. The best dividend stocks often yield a modest 2% to 4% but grow that payment reliably for decades. Using a single year’s data. One year can be distorted by one-time events (like JNJ’s Kenvue spinoff affecting 2023 comparisons). Always look at three to five years of trends to see the underlying pattern. Investor TakeawayEvaluating dividend safety does not require an MBA or a Bloomberg terminal. It requires pulling five numbers from the financial statements, plugging them into simple ratios, and asking whether the company can comfortably afford its dividend today and plausibly grow it tomorrow. Here is the checklist you can save and use for any dividend stock: 1. Adjusted Earnings Payout Ratio: Below 60% is comfortable, above 75% is a warning 2. Free Cash Flow Payout Ratio: Below 70% for stable companies, lower for cyclical ones 3. Net Debt / EBITDA: Below 2.5x, with interest coverage above 5x 4. Revenue Durability: Growing or stable, with reasonable diversification 5. Dividend Growth vs. Earnings Growth: Dividend growth at or below earnings growth over 5+ years Johnson & Johnson passes this framework with strong marks across the board. It is not the highest-yielding stock in the market, but that is the point. The most reliable dividends rarely come with the highest yields. They come from businesses with durable competitive advantages, conservative balance sheets, and management teams that treat the dividend as a priority. Apply this framework to the dividend stocks in your portfolio, and you will sleep a lot better at night knowing which ones are built on a solid foundation and which ones might be built on sand. That is going to wrap up our discussion for today. As always, thank you for taking the time to read this post, and I hope you find something of value on your investing journey. If I can further assist, please don’t hesitate to reach out. Until next time, take care and be safe out there, Dave You're currently a free subscriber to School of Investing. For the full experience, upgrade your subscription.
|

No comments:
Post a Comment